In a data-driven age, making startup decisions “from the gut” is no longer acceptable—especially to investors. Instead, sound business decisions require knowing how your teams and products perform. To simplify how we process the mountains of data available, we need to identify the most critical data to monitor as we manage toward our goals—commonly referred to as key performance indicators.
Key performance indicators — most commonly referred to as “KPIs,” have long been a way for startup organizations to keep score, meet regulatory mandates, or keep tabs on performance. But KPIs can do so much more than that, especially for startups. As Michael Schrage, a visiting research fellow at the MIT Initiative on the Digital Economy, wrote in a report, KPIs can “effectively capture the moment while anticipating the future.” Get your KPI strategy right, and you have a crystal ball to help steer your company as it grows.
Makes sense. But what are “the right metrics”?
In short, the right startup metrics are the KPIs that align with long-term growth — and of course, they will differ from one startup company to another. Focusing on these critical numbers will keep your team focused on what matters and allow you and your investors to keep close tabs on your successes, challenges, and opportunities.
Monitoring the appropriate KPIs will also ensure issues are discovered and addressed immediately and serve as early warning indicators of potential issues or market changes. For instance, if one of your KPIs is customer retention rates and you see that your churn rate is increasing, well-structured KPIs can help you dive quickly into the data to determine why customers are leaving so you can address the problem (more on that later).
KPIs act not only as a feedback mechanism for whether your current strategies — like user acquisition, new features, or onboarding — are working, but they can also be predictive. Monitor the right metrics — and take away the proper lessons from what they are telling you — and KPIs can help you make better-informed, more forward-thinking decisions.
The most successful founders tend to have an obsessive focus on their KPIs. They are driven to optimize them constantly. With this in mind, I will outline the seven essential metrics investors like to see for a quick pulse on your company’s performance. But first, pick the KPIs most applicable to your business and its goals.
1. Activation Rate
As the adage says, “Start from the beginning.” And when it comes to KPIs, that’s the activation rate.
Activation Rate measures the percentage of people who complete a particular milestone in your onboarding process.
To get an accurate idea of your activation rate, you must choose an event to monitor. Whatever event you choose is entirely up to you, but you will want to ensure the marker you choose increases the chances a user will return and continue engaging with your product.
The industry you operate in will significantly influence the events you track. For example, a social platform might watch the percentage of users who add their first friend. An e-commerce app could monitor how many users link their accounts to a credit card. When choosing an activation milestone, look for an event that, when users complete it, often leads to them becoming paying or highly engaged customers.
Calculating Your Activation Rate
You can calculate the activation rate percentage using the formula in Figure 1-1. For example, if 100 people completed a milestone out of 1,000 users who signed up, your activation rate is 10%.
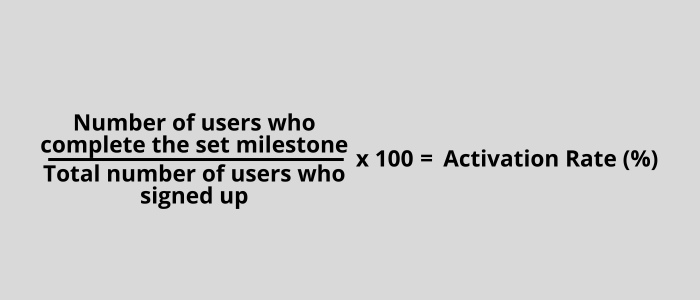
Figure 1-1. Formula to calculate the activation rate
What does a low activation rate indicate? It could mean that your onboarding process has too much friction or involves unnecessary steps that cause users to abandon it. Alternatively, a consistently poor activation rate might also mean you’re attracting poor-quality prospects with your user acquisition efforts. Ultimately, your team must get to the bottom of the cause.
2. Cash Burn Rate
Cash is the lifeblood of any business, and without it, survival is improbable. So, it is no surprise that our following KPI focuses on cash flow.
Burn rate refers to how much your business spends in a month — or, in other words, how quickly your startup is spending money.
This KPI is essential to determine whether your costs-to-income ratio is too low. Once you understand your burn rate, you can make better decisions about investing in growth efforts. For example, if you have a healthy burn rate, you can increase your marketing budget, ramp up product development, or hire more employees.
Calculating Your Burn Rate
You can calculate the burn rate using the formula in Figure 1-2. For example, $1,000,000 – $700,00 = $300,000 burn rate.
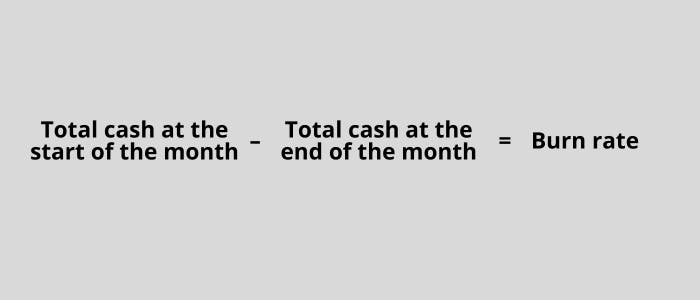
Figure 1-2. Formula to calculate the burn rate
The burn rate will vary significantly depending on the company stage, pricing model, and industry. Burn rate is a more important metric for early-stage startups, especially before they become profitable. A good rule of thumb is always to have enough savings to cover six months’ expenses based on your current burn rate. Don’t assume your burn rate will remain constant. If you are not vigilant about looking for sudden changes, you may overspend or budget incorrectly — so recalculate this metric at regular intervals.
3. Revenue Growth Rate
While we’re on the money, it’s time to talk about revenue. That can be a complicated issue for startups, but we must address it.
Revenue Growth Rate measures a company’s month-over-month increase in revenue.
Many early-stage startups have a major stumbling block when measuring this KPI: they aren’t charging. If you aren’t bringing in revenue, active users (more on that later) are the next best way to calculate the growth rate. When you eventually start charging, revenues will probably be a constant multiple of active users.
Calculating Your Revenue Growth Rate
You can calculate the revenue growth rate using the formula in Figures 1-3 by subtracting the first month’s revenue from the second month’s revenue. Then, divide the result by the first month’s revenue and multiply by 100 to turn it into a percentage. For example, if you have $10,000 in revenue in the first month and $40,000 in the second month, your growth rate would be 300%.
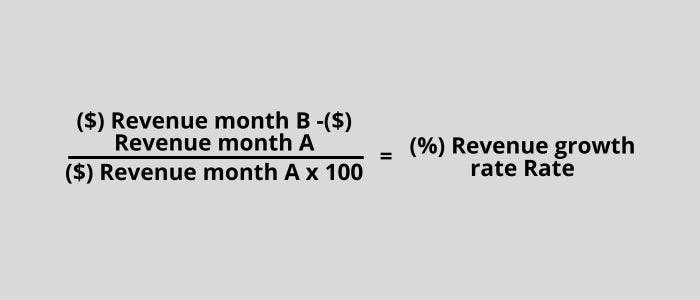
Figure 1-3. Formula to calculate the Revenue Growth Rate
The burn rate will vary significantly depending on the company stage, pricing model, and industry. Burn rate is a more important metric for early-stage startups, especially before they become profitable. A good rule of thumb is always to have enough savings to cover six months’ expenses based on your current burn rate. Don’t assume your burn rate will remain constant. If you are not vigilant about looking for sudden changes, you may overspend or budget incorrectly — so recalculate this metric at regular intervals.
4. Stickiness DAU/MAU Ratio
As we move through this chapter, you will realize there are many ways to understand the stickiness of your product — and this is one of them.
Your Daily Active Users (DAU) to Monthly Active Users (MAU) ratio measures how often people engage with your product.
DAU is the number of unique users who engage with your product within one day. MAU is the number of individual users who engage with your product over a 30-day window. If this ratio is high, it indicates that you have a great product and bodes well for future revenue growth.
Calculating Your DAU/MAU Ratio
You can calculate the DAU/MAU ratio using the formula in Figure 1-4. For example, if the number of daily active users is 200,000 and the total monthly active users are 1,000,000, you have a 20% DAU/MAU ratio. The standard DAU/MAU ratio is 10-20%, with only a handful of companies over 50%.

Figure 1-4. Formula to calculate the DAU/MAU ratio
Ultimately, this KPI allows your team and investors to understand your product’s value to users and provides a snapshot of user retention. This is an essential metric for evaluating traction and potential revenue for early-stage startups.
5. Retention Rate
Customers come and go — that’s the nature of business. However, understanding how quickly you lose customers is imperative to measuring success. On the flip side of retention is churn. Both KPIs are inextricably linked and are critical predictors of future growth. Tracking these metrics — you can choose one or monitor both — can help startups create better strategies to retain customers and decrease unsubscribed ones.
Retention rate evaluates the percentage of customers staying with you over a given period.
Mastering retention is critical to building a long-term business for any startup. Still, marketers from companies of all sizes increasingly recognize this as an essential metric to improve to make user acquisition budgets go further. For startups, it can also be a good predictor of future growth.
Identifying the relationship between specific user actions and retention allows you to find the measures correlated with long-term use. For example, Facebook found that users who added seven friends within the first ten days were highly likely to continue to use the social networking platform long-term.
Calculating Your Retention Rate
The formula for retention can be complicated, but one way to understand this metric is to subtract the number of new customers from your total customers at the end of a given time period, then divide that number by the number of customers you started the time period with, as shown in Figure 1-5 below.
You can easily calculate the retention for any daily/weekly/monthly cohort by looking at how many people who signed up on a specific date (or range of dates) are still using your service N days later. For example, if you started the month with 100 customers, gained 20 new ones, and lost 40, the calculation is 80 (total customers at the end of the month), divided by 100 equals 80%. That means you kept 80% of your customers.

Figure 1-5. Formula to calculate the Retention Rate
Customer retention is incredibly valuable to startups — and businesses of all sizes — as returning customers spend 33% more on average than new customers. This is partly thanks to brand familiarity and the potential for upselling. On the other hand, a low retention rate can be disastrous for your product if not effectively dealt with.
Suppose you need help with a low retention rate. In that case, you can tweak your analysis by breaking your users into specific cohorts (a group of users with a common defining characteristic). For example, you may group mobile app users by when they register. It is one of the easiest ways to calculate retention and helps you pinpoint the problem with your product.
When grouping cohorts by registration dates, you can learn precisely how many people churned per day (per week or month). For example, in the cohort chart in Figure 1-6 below, 13,464 new users signed up on December 1 (Day 0). One day later (Day 1), 57% of those users were still using the app (7,675). Two days later (Day 2), 39.5% of the users who signed up on December 1 still used the app (5,318 users). And by Day 3, retention was at 33.6% of the December 1 cohort (4,524 users).
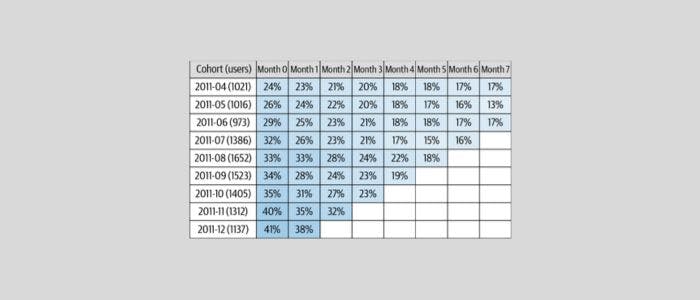
Figure 1-6. An example of the most popular way of displaying cohort data
Cohort analysis is critical because DAU/MAU counts are affected by growth. If your startup is growing rapidly, new user sign-ups will mask a problem with high user churn. If you only look at DAU/MAU, you’ll be blind to retention issues.
6. Customer Acquisition Cost (CAC)
You may have noticed that many of the critical KPIs startups should measure are intertwined with other metrics. That’s especially true of CAC.
Customer Acquisition Cost (CAC) measures how much you spend to acquire a new customer.
If you take one thing away from this section, let it be this: If you want to be profitable, you must ensure that the CAC is significantly lower than a customer’s Lifetime Value (LTV). Ultimately, understanding your CAC allows you to use your marketing budget wisely.
Calculating Your CAC
You can calculate the CAC using the formula in Figure 1-7. The best way is to pick a specific time cohort and divide your user acquisition cost by the number of customers you gained. For example, if you spent $1,000 to get 50 customers, your CAC is $20.

Figure 1-7. Formula to calculate the Customer Acquisition Cost (CAC)
The CAC is going to differ according to your business model and industry. For instance, you may spend more to acquire new customers as a subscription business than a business that sells low-cost consumer goods. The ideal LTV: CAC ratio benchmark strives to be 3:1 for most companies.
7. Customer Lifetime Value (LTV)
We’ve reached the end of the KPI line, and we should end on a forward-looking metric.
Customer Lifetime Value measures the revenue you receive from repeat customers over your relationship with them.
Because LTV is a predictive metric, past data is required to get an accurate measurement. Still, startups need to calculate LTV as soon as they have enough data because it helps determine their ideal CAC and reduces the burn rate. Simply put, the greater the estimated lifetime revenue of a customer, the more you can afford to spend to acquire that customer.
Calculating Your LTV
To calculate LTV, you need to calculate the average conversion value and multiply that number by the average purchase frequency rate to determine customer value, as shown in Figure 1-8 below. Then, once you calculate the average customer lifespan, you can multiply that by customer value to determine customer lifetime value. For example, a paid subscription business earns $10 per month per user, and the average user lifetime is 12 months; the average LTV is $120.
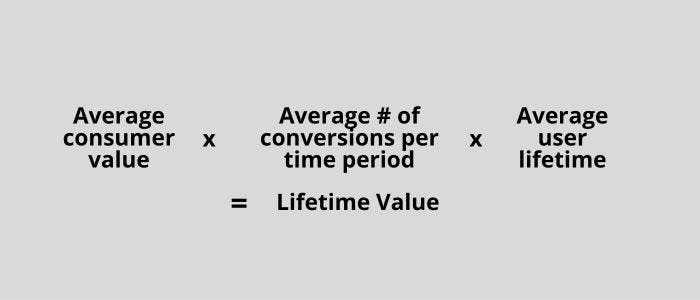
Figure 1-8. The formula for calculating Customer Lifetime Value (LTV)
Tracking your LTV is crucial because it also helps you evaluate your product, brand, user experience, and customer service quality. It’s hard to monetize customers who are unhappy with your business, so keep an eye on whether your LTV is trending up or down.
Ultimately, you want to focus on the key metrics that align with driving long-term growth.
Bold Claims
- Beware of vanity metrics. Spending time measuring things that don’t matter to your business’s success can squander precious time and resources and lead to making the wrong decisions to grow your business.
- Track not only what customers do but also what they say. Metrics like Net Promoter Score (NPS), Customer Satisfaction Score (CSAT), and Customer Effort Score (CES) are designed to gather maximum insight with minimum customer disruption. You ignore them at your peril.
Pro Tips
- If you have raised significant money and don’t anticipate using it within the first year, you may park it in a safe environment, such as a fixed deposit with your bank.
- The supply of new customers is finite. By creating magical moments for your existing users and emphasizing engagement and retention, you can establish a more holistic view of growth that will serve you better in the long run.
- To truly understand how your company measures up, you need competitive benchmarking data to see how you compare to the rest of your vertical.
Subscribe to my LEAN 360 newsletter to learn more about startup insights.


